
도찐개찐
[머신러닝] 02. sklearn 본문
sklearn
- 파이썬 기반 쉽고 효율적인 머신러닝 라이브러리 제공
- 머신러닝을 위한 다양한 알고리즘 제공
- 데이터셋, 데이터전처리, 지도/비지도학습, 모델 선택/평가 등을 위한 모듈 제공
- scikit-learn.org
# !pip install scikit-learnimport numpy as np
import pandas as pd
import matplotlib.pyplot as plt
import sklearnsklearn.__version__'1.1.3'scikit-learn에서 제공하는 데이터셋 확인
- load : 내장된 데이터셋 불러옴
- fetch : 인터넷을 통해 내려받는 대량 데이터
- make : 확률분포에 근거해서 생성하는 가상 데이터
from sklearn.datasets import load_boston
from sklearn.datasets import load_iris
from sklearn.datasets import load_digits
iris = load_iris()
boston = load_boston()
digit = load_digits()/opt/miniconda3/lib/python3.9/site-packages/sklearn/utils/deprecation.py:87: FutureWarning: Function load_boston is deprecated; `load_boston` is deprecated in 1.0 and will be removed in 1.2.
The Boston housing prices dataset has an ethical problem. You can refer to
the documentation of this function for further details.
The scikit-learn maintainers therefore strongly discourage the use of this
dataset unless the purpose of the code is to study and educate about
ethical issues in data science and machine learning.
In this special case, you can fetch the dataset from the original
source::
import pandas as pd
import numpy as np
data_url = "http://lib.stat.cmu.edu/datasets/boston"
raw_df = pd.read_csv(data_url, sep="\s+", skiprows=22, header=None)
data = np.hstack([raw_df.values[::2, :], raw_df.values[1::2, :2]])
target = raw_df.values[1::2, 2]
Alternative datasets include the California housing dataset (i.e.
:func:`~sklearn.datasets.fetch_california_housing`) and the Ames housing
dataset. You can load the datasets as follows::
from sklearn.datasets import fetch_california_housing
housing = fetch_california_housing()
for the California housing dataset and::
from sklearn.datasets import fetch_openml
housing = fetch_openml(name="house_prices", as_frame=True)
for the Ames housing dataset.
warnings.warn(msg, category=FutureWarning)# 버전 업이 되면 보스턴 데이터 삭제 대체 사용 방법
# import pandas as pd
# import numpy as np
# data_url = "http://lib.stat.cmu.edu/datasets/boston"
# raw_df = pd.read_csv(data_url, sep="\s+", skiprows=22, header=None)
# data = np.hstack([raw_df.values[::2, :], raw_df.values[1::2, :2]])
# target = raw_df.values[1::2, 2]
# 대안으로 켈리포니아 데이터 사용 방법
# from sklearn.datasets import fetch_california_housing
# housing = fetch_california_housing()
# 대안으로 집값 데이터 사용
# from sklearn.datasets import fetch_openml
# housing = fetch_openml(name="house_prices", as_frame=True)내장 데이터 속성 살펴보기
- DESCR
- data
- target
- feature_names
- target_names
# 데이터셋 설명 확인
print(iris.DESCR)
.. _iris_dataset:
Iris plants dataset
--------------------
**Data Set Characteristics:**
:Number of Instances: 150 (50 in each of three classes)
:Number of Attributes: 4 numeric, predictive attributes and the class
:Attribute Information:
- sepal length in cm
- sepal width in cm
- petal length in cm
- petal width in cm
- class:
- Iris-Setosa
- Iris-Versicolour
- Iris-Virginica
:Summary Statistics:
============== ==== ==== ======= ===== ====================
Min Max Mean SD Class Correlation
============== ==== ==== ======= ===== ====================
sepal length: 4.3 7.9 5.84 0.83 0.7826
sepal width: 2.0 4.4 3.05 0.43 -0.4194
petal length: 1.0 6.9 3.76 1.76 0.9490 (high!)
petal width: 0.1 2.5 1.20 0.76 0.9565 (high!)
============== ==== ==== ======= ===== ====================
:Missing Attribute Values: None
:Class Distribution: 33.3% for each of 3 classes.
:Creator: R.A. Fisher
:Donor: Michael Marshall (MARSHALL%PLU@io.arc.nasa.gov)
:Date: July, 1988
The famous Iris database, first used by Sir R.A. Fisher. The dataset is taken
from Fisher's paper. Note that it's the same as in R, but not as in the UCI
Machine Learning Repository, which has two wrong data points.
This is perhaps the best known database to be found in the
pattern recognition literature. Fisher's paper is a classic in the field and
is referenced frequently to this day. (See Duda & Hart, for example.) The
data set contains 3 classes of 50 instances each, where each class refers to a
type of iris plant. One class is linearly separable from the other 2; the
latter are NOT linearly separable from each other.
.. topic:: References
- Fisher, R.A. "The use of multiple measurements in taxonomic problems"
Annual Eugenics, 7, Part II, 179-188 (1936); also in "Contributions to
Mathematical Statistics" (John Wiley, NY, 1950).
- Duda, R.O., & Hart, P.E. (1973) Pattern Classification and Scene Analysis.
(Q327.D83) John Wiley & Sons. ISBN 0-471-22361-1. See page 218.
- Dasarathy, B.V. (1980) "Nosing Around the Neighborhood: A New System
Structure and Classification Rule for Recognition in Partially Exposed
Environments". IEEE Transactions on Pattern Analysis and Machine
Intelligence, Vol. PAMI-2, No. 1, 67-71.
- Gates, G.W. (1972) "The Reduced Nearest Neighbor Rule". IEEE Transactions
on Information Theory, May 1972, 431-433.
- See also: 1988 MLC Proceedings, 54-64. Cheeseman et al"s AUTOCLASS II
conceptual clustering system finds 3 classes in the data.
- Many, many more ...# 데이터셋 중 독립변수 feature 확인 - numpy array
iris.data[:5]
# print(type(iris.data))array([[5.1, 3.5, 1.4, 0.2],
[4.9, 3. , 1.4, 0.2],
[4.7, 3.2, 1.3, 0.2],
[4.6, 3.1, 1.5, 0.2],
[5. , 3.6, 1.4, 0.2]])# 데이터셋 중 종속변수target 확인 - numpy array
iris.target[:5]array([0, 0, 0, 0, 0])iris.feature_names['sepal length (cm)',
'sepal width (cm)',
'petal length (cm)',
'petal width (cm)']# 종속 변수 feature 범주 확인
iris.target_namesarray(['setosa', 'versicolor', 'virginica'], dtype='<U10')# 픽셀기반 데이터 확인
print(digit.DESCR).. _digits_dataset:
Optical recognition of handwritten digits dataset
--------------------------------------------------
**Data Set Characteristics:**
:Number of Instances: 1797
:Number of Attributes: 64
:Attribute Information: 8x8 image of integer pixels in the range 0..16.
:Missing Attribute Values: None
:Creator: E. Alpaydin (alpaydin '@' boun.edu.tr)
:Date: July; 1998
This is a copy of the test set of the UCI ML hand-written digits datasets
https://archive.ics.uci.edu/ml/datasets/Optical+Recognition+of+Handwritten+Digits
The data set contains images of hand-written digits: 10 classes where
each class refers to a digit.
Preprocessing programs made available by NIST were used to extract
normalized bitmaps of handwritten digits from a preprinted form. From a
total of 43 people, 30 contributed to the training set and different 13
to the test set. 32x32 bitmaps are divided into nonoverlapping blocks of
4x4 and the number of on pixels are counted in each block. This generates
an input matrix of 8x8 where each element is an integer in the range
0..16. This reduces dimensionality and gives invariance to small
distortions.
For info on NIST preprocessing routines, see M. D. Garris, J. L. Blue, G.
T. Candela, D. L. Dimmick, J. Geist, P. J. Grother, S. A. Janet, and C.
L. Wilson, NIST Form-Based Handprint Recognition System, NISTIR 5469,
1994.
.. topic:: References
- C. Kaynak (1995) Methods of Combining Multiple Classifiers and Their
Applications to Handwritten Digit Recognition, MSc Thesis, Institute of
Graduate Studies in Science and Engineering, Bogazici University.
- E. Alpaydin, C. Kaynak (1998) Cascading Classifiers, Kybernetika.
- Ken Tang and Ponnuthurai N. Suganthan and Xi Yao and A. Kai Qin.
Linear dimensionalityreduction using relevance weighted LDA. School of
Electrical and Electronic Engineering Nanyang Technological University.
2005.
- Claudio Gentile. A New Approximate Maximal Margin Classification
Algorithm. NIPS. 2000.# 픽셀 기반 데이터 확인1
digit.data[:1]array([[ 0., 0., 5., 13., 9., 1., 0., 0., 0., 0., 13., 15., 10.,
15., 5., 0., 0., 3., 15., 2., 0., 11., 8., 0., 0., 4.,
12., 0., 0., 8., 8., 0., 0., 5., 8., 0., 0., 9., 8.,
0., 0., 4., 11., 0., 1., 12., 7., 0., 0., 2., 14., 5.,
10., 12., 0., 0., 0., 0., 6., 13., 10., 0., 0., 0.]])# 픽셀 기반 데이터 확인 2
digit.images[:1]array([[[ 0., 0., 5., 13., 9., 1., 0., 0.],
[ 0., 0., 13., 15., 10., 15., 5., 0.],
[ 0., 3., 15., 2., 0., 11., 8., 0.],
[ 0., 4., 12., 0., 0., 8., 8., 0.],
[ 0., 5., 8., 0., 0., 9., 8., 0.],
[ 0., 4., 11., 0., 1., 12., 7., 0.],
[ 0., 2., 14., 5., 10., 12., 0., 0.],
[ 0., 0., 6., 13., 10., 0., 0., 0.]]])digit.target[:1]array([0])imglbl = list(zip(digit.images, digit.target))
# print(imglbl)
for ix, (img, lbl) in enumerate(imglbl[:10]):
plt.subplot(2, 5, ix + 1) # 2행 5열 형태로 레이블 형성
plt.axis(False)
# 그림데이터 출력 함수 imshow
# 이미지 픽셀 보정 interpolation
plt.imshow(img, interpolation='nearest', cmap=plt.cm.gray_r)
# 각 시각화 데이터 별 제목 붙이기
plt.title(f'num:{lbl}')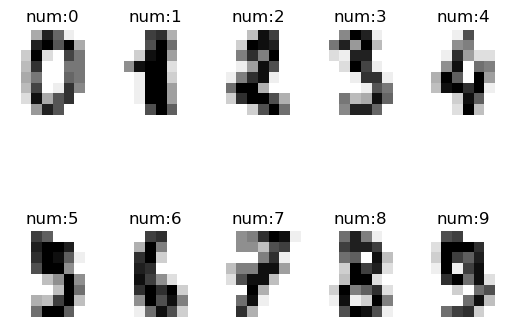
인터넷으로 내려받은 데이터셋 확인
import PIL
from sklearn.datasets import fetch_lfw_people
people = fetch_lfw_people(min_faces_per_person=25, resize=0.4)print(people.DESCR)imglbl = list(zip(people.images, people.target))
plt.figure(figsize=(20, 15))
for ix, (img, lbl) in enumerate(imglbl[:50]):
plt.subplot(5, 10, ix+1)
plt.axis(False)
plt.imshow(img, interpolation='nearest', cmap=plt.cm.gray)
plt.title(f'{people.target_names[lbl]}')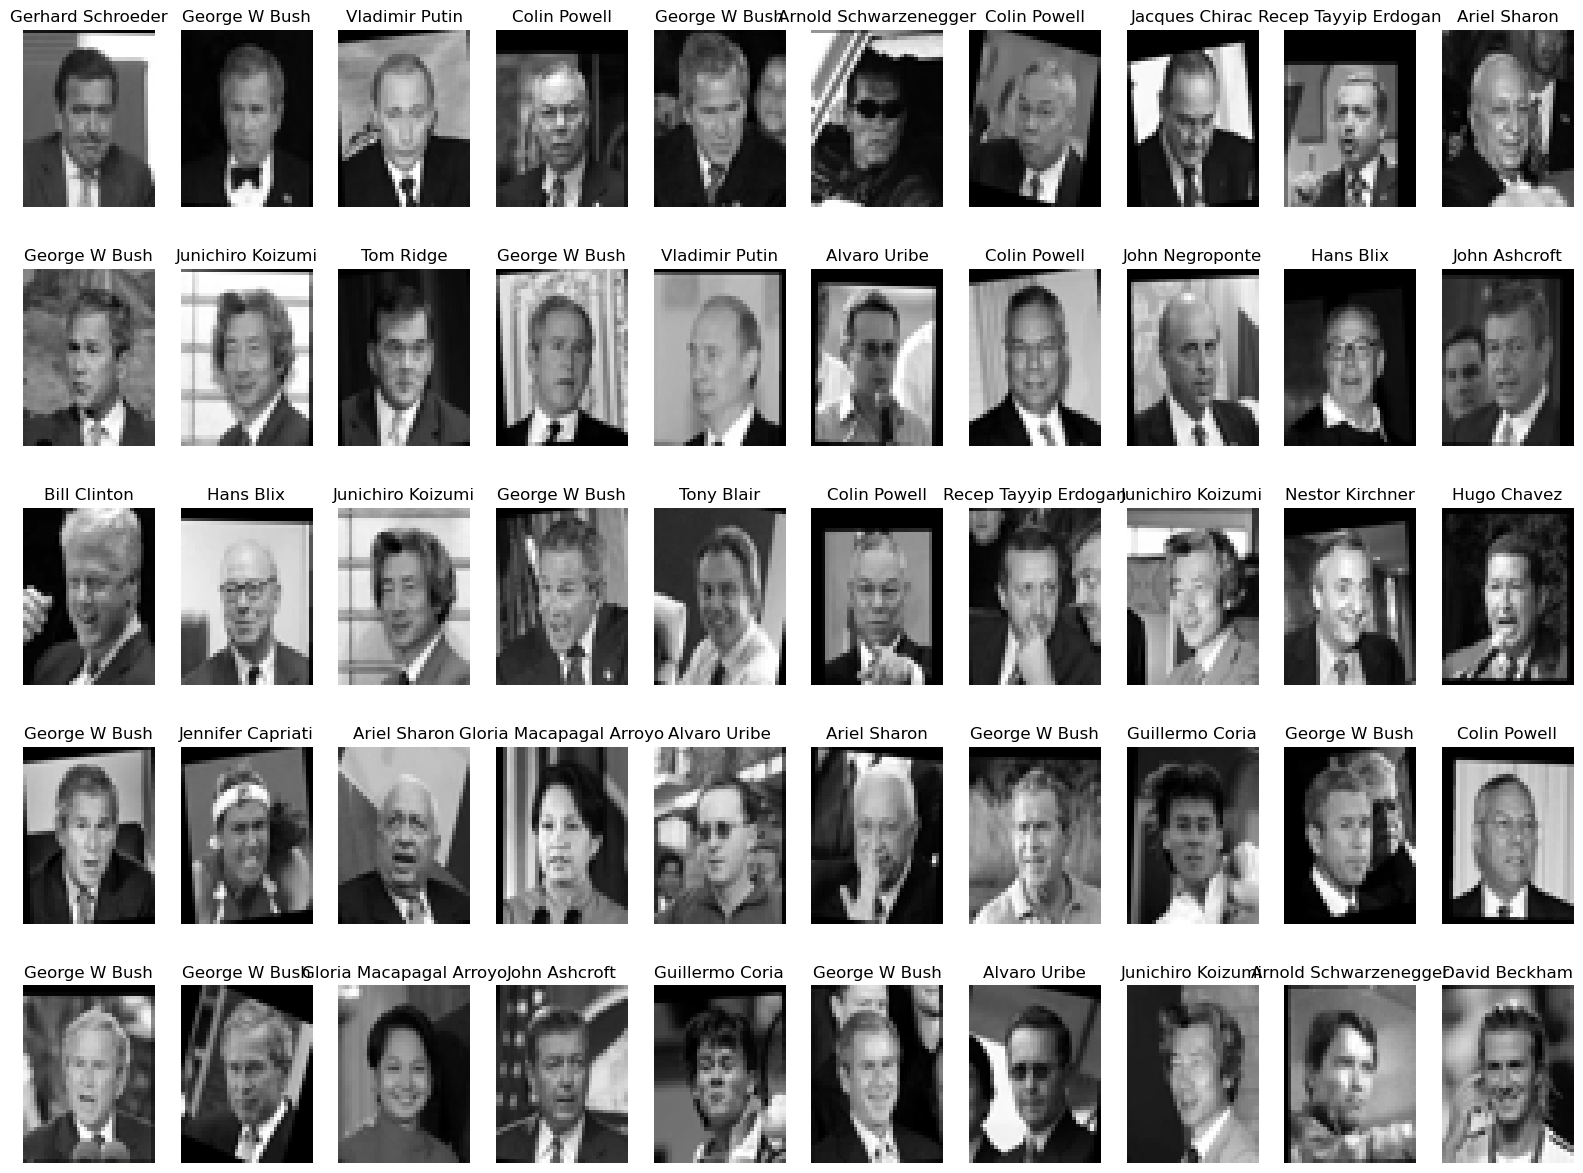
people2 = fetch_lfw_people(min_faces_per_person=25, resize=0.4, color=True)/opt/miniconda3/lib/python3.9/site-packages/sklearn/datasets/_lfw.py:332: UserWarning: Persisting input arguments took 0.56s to run.
If this happens often in your code, it can cause performance problems
(results will be correct in all cases).
The reason for this is probably some large input arguments for a wrapped
function (e.g. large strings).
THIS IS A JOBLIB ISSUE. If you can, kindly provide the joblib's team with an
example so that they can fix the problem.
faces, target, target_names = load_func(imglbl = list(zip(people2.images, people2.target))
plt.figure(figsize=(20, 15))
for ix, (img, lbl) in enumerate(imglbl[:50]):
plt.subplot(5, 10, ix+1)
plt.axis(False)
plt.imshow(img, interpolation='nearest')
plt.title(f'{people2.target_names[lbl]}')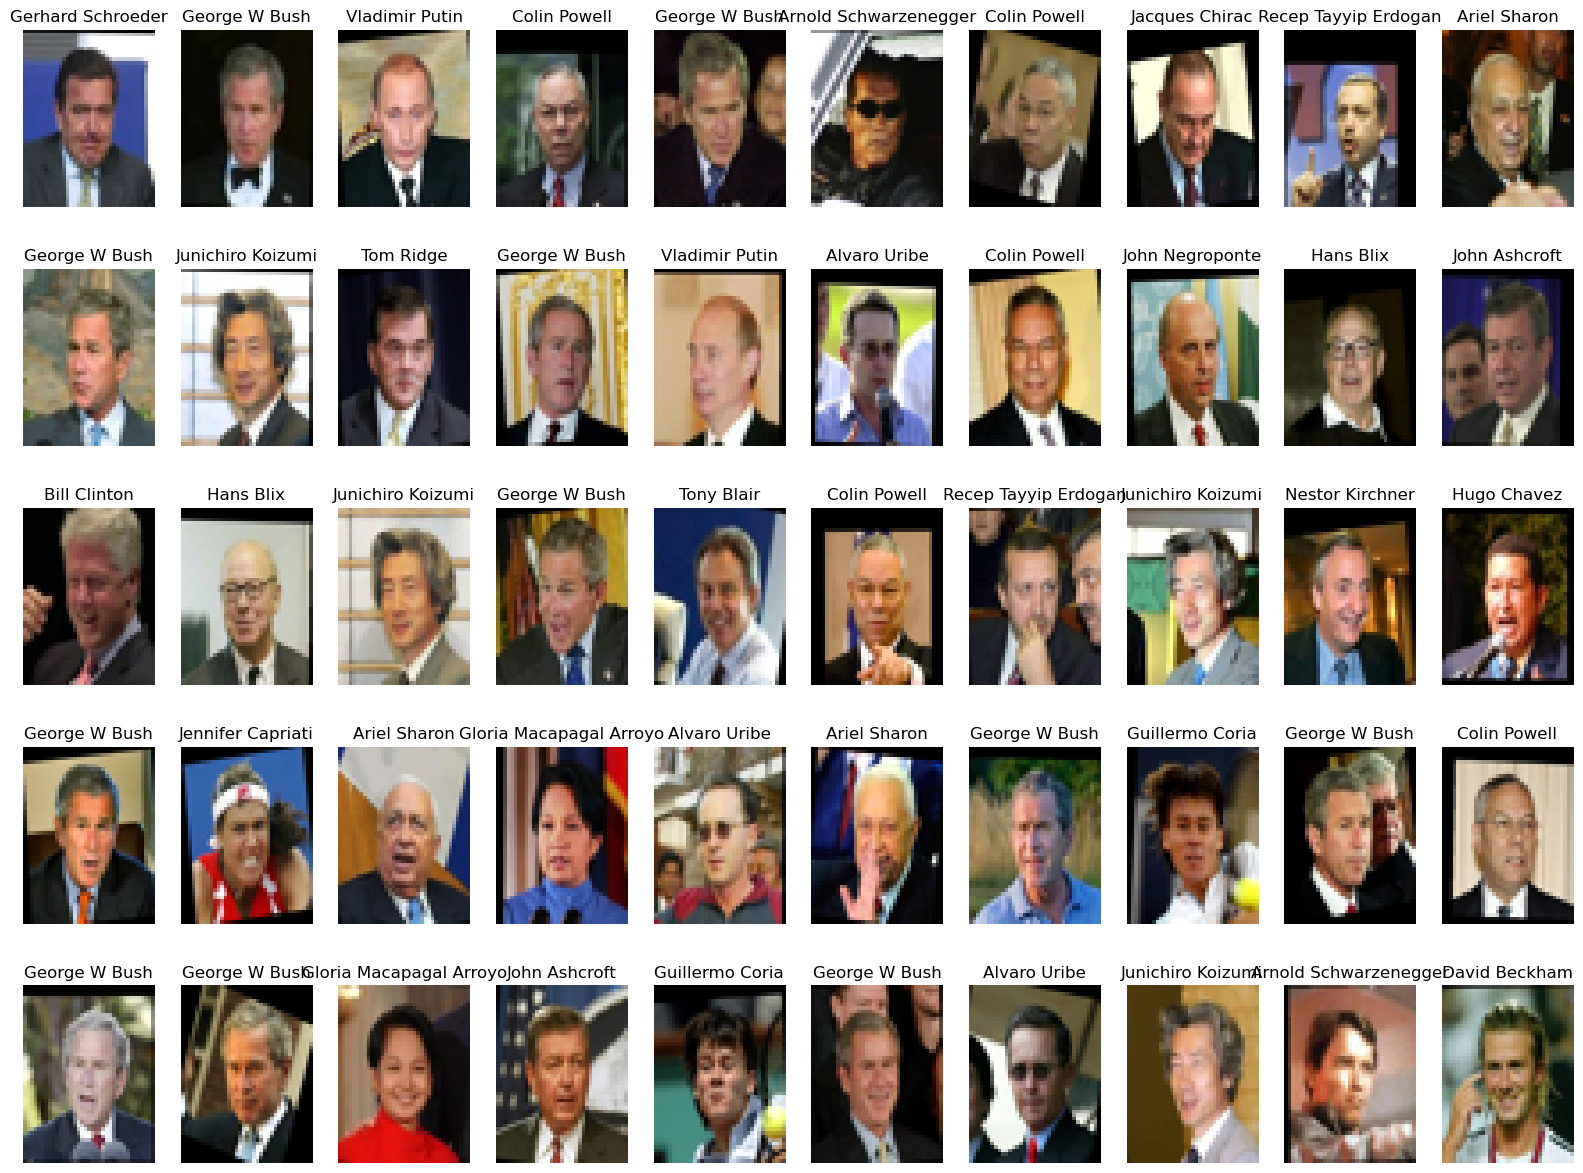
728x90
'PYTHON > 데이터분석' 카테고리의 다른 글
| [머신러닝] 04. 머신러닝 타이타닉 생존자 예측 (0) | 2023.01.03 |
|---|---|
| [머신러닝] 03. 훈련과 테스트 데이터 (0) | 2023.01.03 |
| [머신러닝] 01. 인공지능 정의 (0) | 2023.01.02 |
| [데이터분석] 13. 다중회귀분석 (0) | 2023.01.02 |
| [데이터분석] 12. 회귀분석 (0) | 2023.01.02 |
'PYTHON/데이터분석' Related Articles
more

Comments